
CSUN Creates Maps to Track COVID-19’s Progress Neighborhood By Neighborhood in L.A. County and County by County Across the U.S.
CSUN geography professor Steven Graves and Danielle Bram with the Center for Geospatial Science and Technology have created interactive maps that track the virus’ progress county by county on the national level, and neighborhood by neighborhood in Los Angeles County. Image courtesy of Steven Graves.
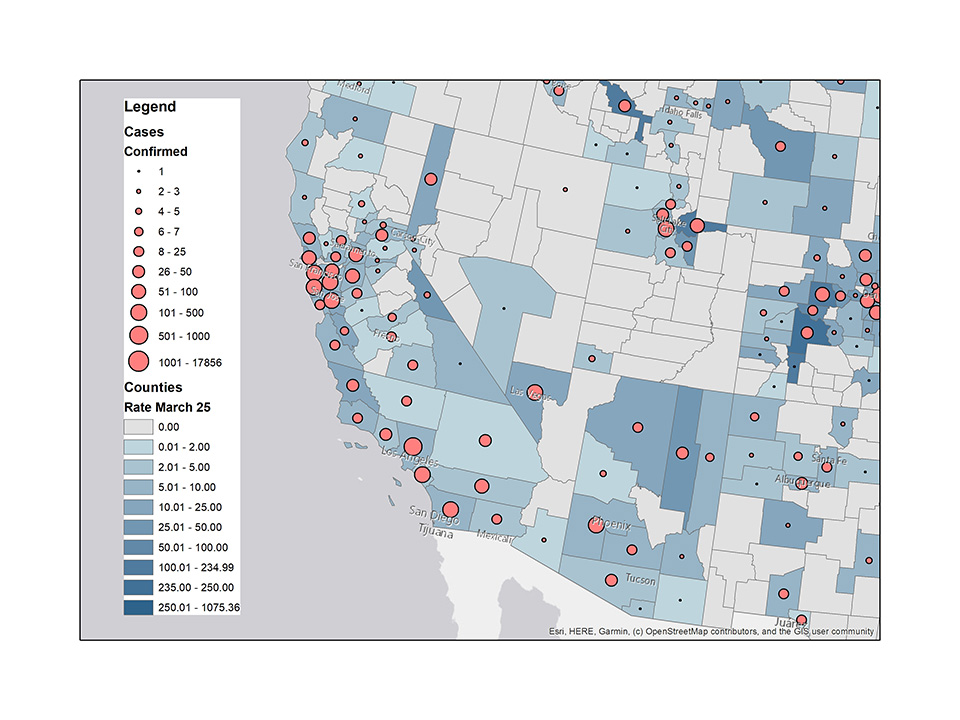
Hoping to get a better grasp on how COVID-19 is impacting people at the local level, California State University, Northridge geography professor Steven Graves and his colleagues have created interactive maps that track the virus’ progress county by county on the national level. A second map, created by CSUN’s Center for Geospatial Science and Technology, tracks the virus neighborhood by neighborhood in Los Angeles County.
The maps are located on the Center for Geospatial Science and Technology’s webpage.
Graves said the county and neighborhood maps were created because the maps found online “didn’t really give me a sense of what was happening in my community at the county level.”
He pointed to one map of the coronavirus in the United States that featured a big red dot on the state of California.
“That doesn’t really tell me anything,” Graves said. “We have more than 10 million people here in Los Angeles County. Up in Alpine County, there are only about 1,200 people. That’s a big difference,” he said. “That big red blob doesn’t tell me if the number of cases has grown in Sonoma County, L.A. County or in Chico. Yes, it’s a red growing dot, but it doesn’t allow you to zoom in on your own location, or put what you’re seeing in context.”
Working with data drawn from the Johns Hopkins’ website, Graves and his students — using geographic information system (GIS) software — created an interactive map that tracks the progress of the coronavirus in counties across the United States. The map includes the population of each county to put the numbers of positive cases of COVID-19 into context. Danielle Bram with CSUN’s Center for Geospatial Science and Technology created a similar map to track cases neighborhood by neighborhood in Los Angeles County.
“It’s one thing to report the numbers, but if there is no context, they really don’t mean anything,” Graves said, adding that reports of a couple hundred confirmed cases of COVID-19 in a county with a population in the millions mean something different than a dozen reported cases in a county with a population of less than 100,000.
“Five hundred confirmed cases in a county of 10 million people translates to about five persons per 100,000 people, which is not great but better than a country of less than 100,000 people with 12 confirmed cases,” he said.
“Places that have population density, a lot of tourism and international airports — places like New York, Los Angeles and San Francisco — are going to have high rates of the virus,” he continued. But some other places have far more cases than you would expect, given their characteristics. I think that’s important to see.”
By tracking the coronavirus’ progress by county, Graves is hoping the data will raise red flags in some areas, and identify other areas where it appears efforts to fight the virus’ spread are working.
“We can learn from those places where the numbers appear to grow at a slower rate and share with those places that appear vulnerable,” he said.
“Right now, we have to take all of this with a grain of salt,” he continued. “We don’t really know how good the data tracking those with the coronavirus is. Everyone is doing the best they can. But once the rate at which people are being tested improves, then we will have a better picture of what is going on. Right now, our maps are creating a foundation on which we will eventually create a better picture of what is going on in the country, county by county.”